IonLab
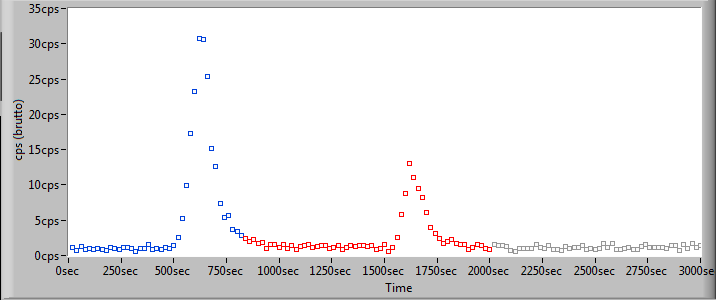
IONLab is a basic remote-controlled ion-chromatography setup. It allows the user to apply a mixture of radionuclides onto a column and then use a selection of solvents for the elution. The separation is followed by a Geiger-detection that yields a simple chromatogram of the activity. In order to enhance out-of-solution-detection a small slide takes up the drop-shaped liquid coming from the column and transforms it into a thin-layered laminar flow. The experiment can be used to learn the fundamentals in theoretical, as well as practical chromatography and demonstrates the potential of chromatographical methods for the separation of radionuclides. At the moment it is set-up to perform an Y-90/Sr-90-separation using Sr-Resin as a solid extraction phase and different nitric acid concentrations for the separate elution.
Outcome:
- Learning the fundamentals in theoretical, as well as practical chromatography
- Demonstration of the potential of chromatographical methods for the separation of radionuclides
The setup is presented in Figure 1.
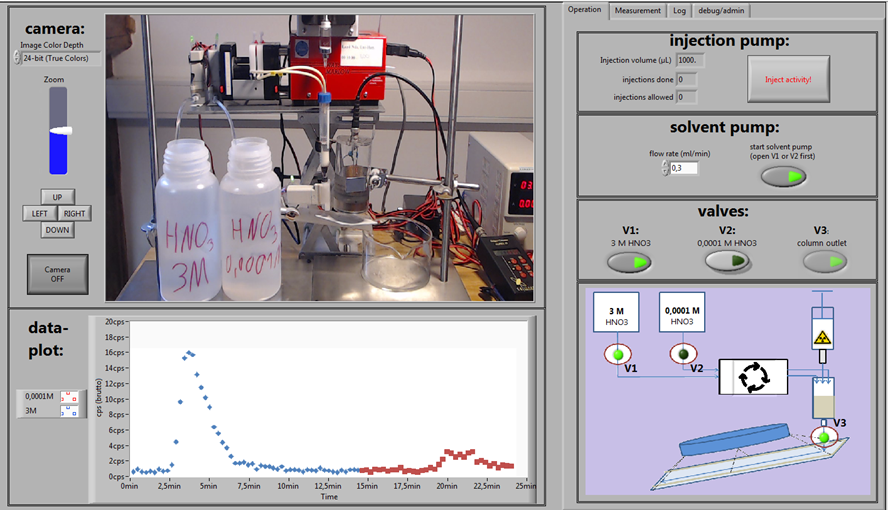
Fig. 1. IonLab setup
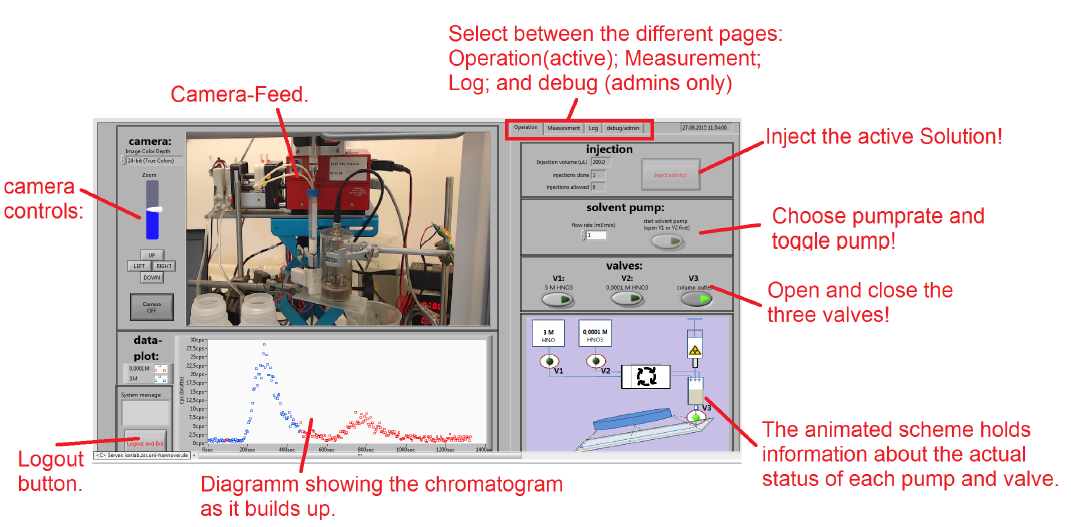
The interface is divided in two parts. The left side shows the camera feed and a chromatogram which builds up throughout the experiment - these two elements are visible at all times. On the right side of the interface you will see four different control tabs: “Operation”, “Measurement”, “Log” and “debug/admin”(this last tab is accessible only for the supervisors: here are functions located, which are not accessible in normal operation, but can be used to adjust basic experimental parameters - quantity of the injected radioactivity, number of times the injection is permitted, speed of the pumps, etc. ).
The “Operation” tab allows you to control the valves and the pumps. In this tab, at the bottom right you can see a simplified sketch of IonLab, which shows the current status of the experiment (if the pumps are in use, which valves are open, etc).
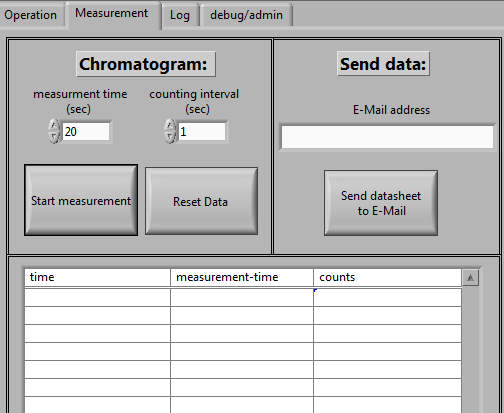
The “Measurement” tab permits to set the measurement time for the experiment, and also to start recording the values. When you start a measurement, the worksheet in this tab starts to record the values obtained from the Geiger-Müller counter. Simultaneously in the graph on the left half of the screen, these values start to be plotted. Depending on which eluent is being used, are the plotted points in different colors: blue for the 3M HNO3 solution and red for the 10-4 M HNO3. The data which is recorded in the worksheet can be retrieved via copy & paste or sent to you via email.
The “Log” tab records every action you have performed since the start of the experiment (opening of valves, injection of activity, start of the measurement, etc). You can also record your own notes, if you want (can be useful for the later evaluation). This file can also be sent via mail.
You can quit the experiment by pressing on the bottom left the "Logout and Exit" button.
Step 1 – Turn on the camera feed
Turn on the camera image by clicking the “On” button in the center of the left screen area. You can zoom in using zoom bar. After magnifying the image, you can select an image section for viewing using the 'up', 'down', 'left' and 'right' buttons.
Important: Before starting the experiment, please check using the camera the reservoir of the solvent and the level of the injection syringe! Markings on the storage vessels mark the minimum level required for a run. If one of the fill lines is not reached, the experiment can not be carried out! In this case, please inform your supervisor.
To start the experiment click the button 'V3' which opens the column outlet valve. Like this the solvent, which remains in the column between two runs of the experiment, is being eluted. Valve three can no longer be activated and will be automatically closed by the program after completion of the experiment.
Step 2 – Conditioning
The column should be conditioned for the experiment to run. Open 'V1'. Then select the highest possible elution speed in the field 'solvent pump' and then click on the button 'start/stop solvent pump'. The rotation of the peristaltic pump, as well as the deposition of the solvent drops at the end of the detection slide, can be seen in the camera feed. 5 minutes are enough to adequately condition the column material.
Step 3 – Injection of the radioactive solution
Inject the radioactive solution using the syringe pump, by pressing 'Inject activity' in the field 'Injection'. The animated experimental scheme in the lower right corner, as well as the camera window of the injection process, can be used to follow the status of the experiment. After the injection process has been completed, please wait a few seconds for the applied solution to settle evenly at the top of the separation column.
Step 4 – First elution
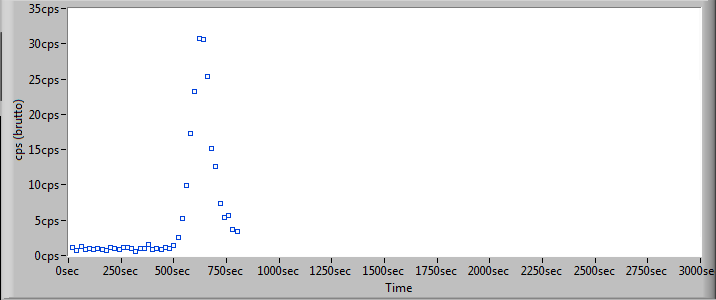
Select the desired elution speed in the field 'solvent pump' and start the elution by clicking again on 'start / stop solvent pump'. Afterwards go to the 'Measurement' tab and start the measurement series by clicking on 'Start measurement'. The chromatogram and the table will start to fill with the measurement values of the activity. After a few minutes, you will see a clear signal.
Step 5 – Second elution
When the signal attenuates significantly, change the eluent. For that, click on the switch 'V2'. Valve 1 will be automatically closed, and from this moment on the elution will be performed with the diluted solvent. After a few minutes, a second signal will appear in the chromatogram. After this has also completely decayed, the measurement is terminated. Zou have two options for retrieving the measured data: you can select the data in the table and paste it into an external evaluation program with 'copy & paste', or you can have them sent to their e-mail address using the 'Send datasheet to Email' button in the ‘Measurement’ tab.
Step 6 – Shutting down IonLab
All you have to do is to press the “Logout and exit”-button. Close your browser.
